The data we are taking a look at is an excerpt of data from Expedia’s hotel line of business. It contains logs of customer hotel searches, sampled from 2015, either for a hotel only or in a package with air tickets or car rental, but always involving a hotel (and only recording the hotel interactions). These interactions are clicks on hotels in the search, and actual bookings.
The scale of the data is massive, with over 10 million rows! Unfortunately, when using a Google Colab environment, it simply runs out of RAM from this massive amount of data when performing KMeans clustering with one-hot encoded variables and hand-generated features to predict the hotel clusters, and so the data had to be down-sampled to record the logs of 100,000 unique users (almost 1,500,000 rows of data).
Our goal is to explore the journey of a traveler through the Web site and uncover any of the secrets that lie in the data — from patterns in seasonality and day of the week, to finding signals from customers who might prefer a vacation rental property rather than a hotel, and everything in between.
Exploring the Data
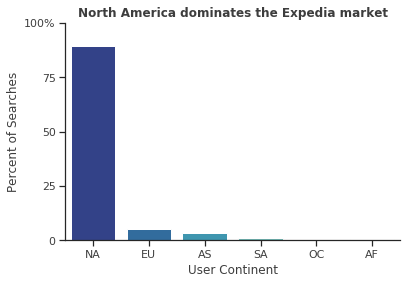
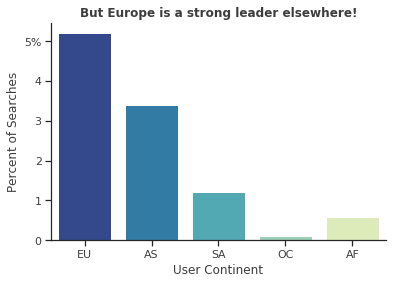
Our foray into the data begins with the engineered feature for user continent. From the graph, we can see that North American users offer a staggering 88% of the traffic to Expedia for hotels, and the other bars in the graph are tiny in comparison. If we analyze just the other 5 continents (sorry, Antarctica), then we see that Europe is the next most popular origin for Expedia users. Surprisingly, Oceania has the least number of searches, so maybe their market is taken up by other companies in the hotel realm of business.
The Mobile Market
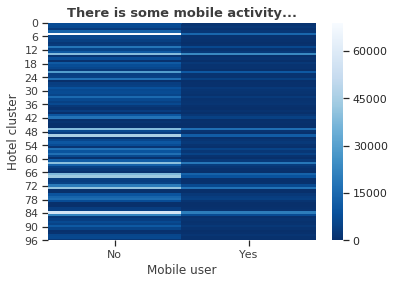
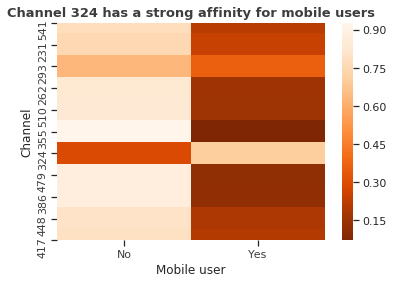
The next section of data that I was interested in exploring was the amount of mobile traffic that Expedia sees compared to PC users. We can see that each cluster of hotels has some sort of mobile activity, but by looking at the proportions for each cluster, mobile search is always outpaced by PC users in each cluster.
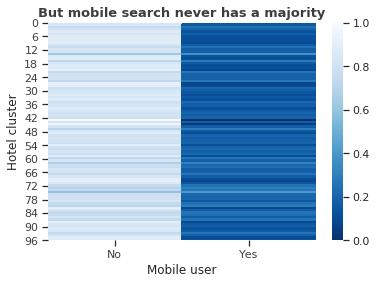
The bar graph here gives us further evidence instead of the fuzzy color mapping to show us truly that mobile search is very underwhelming compared to the number of PC users across the board.

Package Deals
Now, let’s take a look at the package deals. From the simple count graphs, you can see that non-package searches are generally more popular than package searches.

This might be true that non-package searches are less popular, but some hotel clusters show that package deals are actually more preferable! From the proportion graphs, we can see that 17 of the 100 clusters that were generated lean towards users who are more likely to purchase a package deal with a flight and/or car rental.

Advertising Channels
The final piece of data that I wanted to take a look at is the (advertising) channel that each user took in order to bring themselves to the Expedia website and how that channel relates to the other data we’ve seen. We don’t really have any other information besides the channel ID, so the easiest analysis that we can do is a quick count of the data.
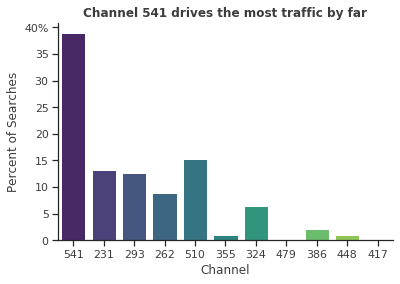
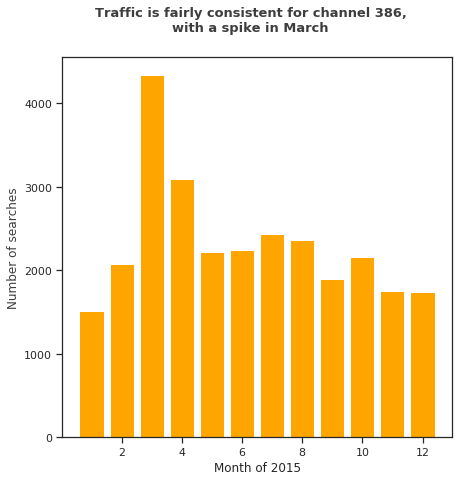
We were also given the exact day and time that each click event occurred. From this data, each date and time was converted to a Pandas datetime. Only the month column was recovered after converting the datetime in order to provide this analysis. The three advertising channels that I was particularly interested in were the most popular (541), and the two channels with the least mobile traffic (386 and 479).
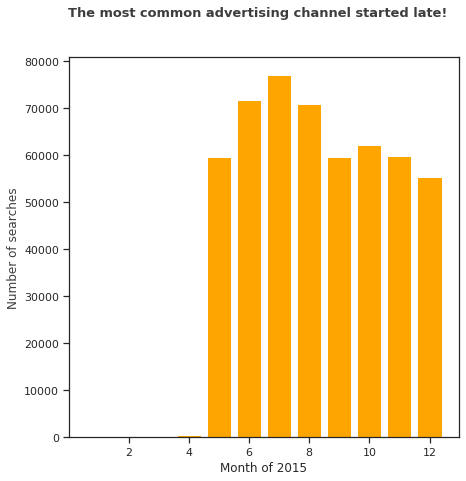
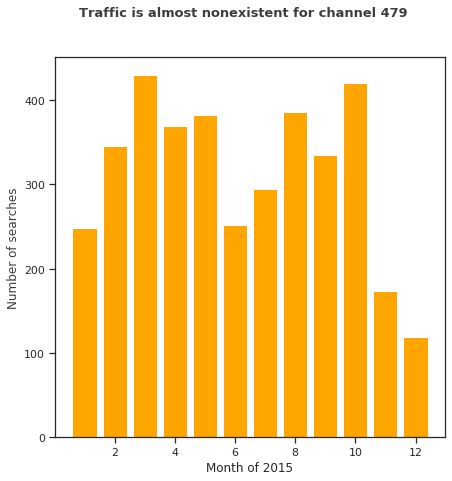
Compared to the other advertising channels that were provided in the data, channel 541 started in May 2015 and lends to a huge amount of traffic compared to the other channels.
Channels 386 and 479, on the other hand, are certainly not as active now (or anymore), and from the bar chart of total traffic, we can see that they leave a lot to be desired in terms of generating traffic compared to the other avenues.
Closing Thoughts
This analysis is left pretty open-ended, and there’s a lot of work left to do, including analysis of the other columns from the data that we were provided. I hope this is still a decent insight into how hotel data can be analyzed in order to help find better areas of focus for the business.